Blog

  • Anglesey Food Community Christmas Mapathon

    Menter Mon Food Partners Mapathon

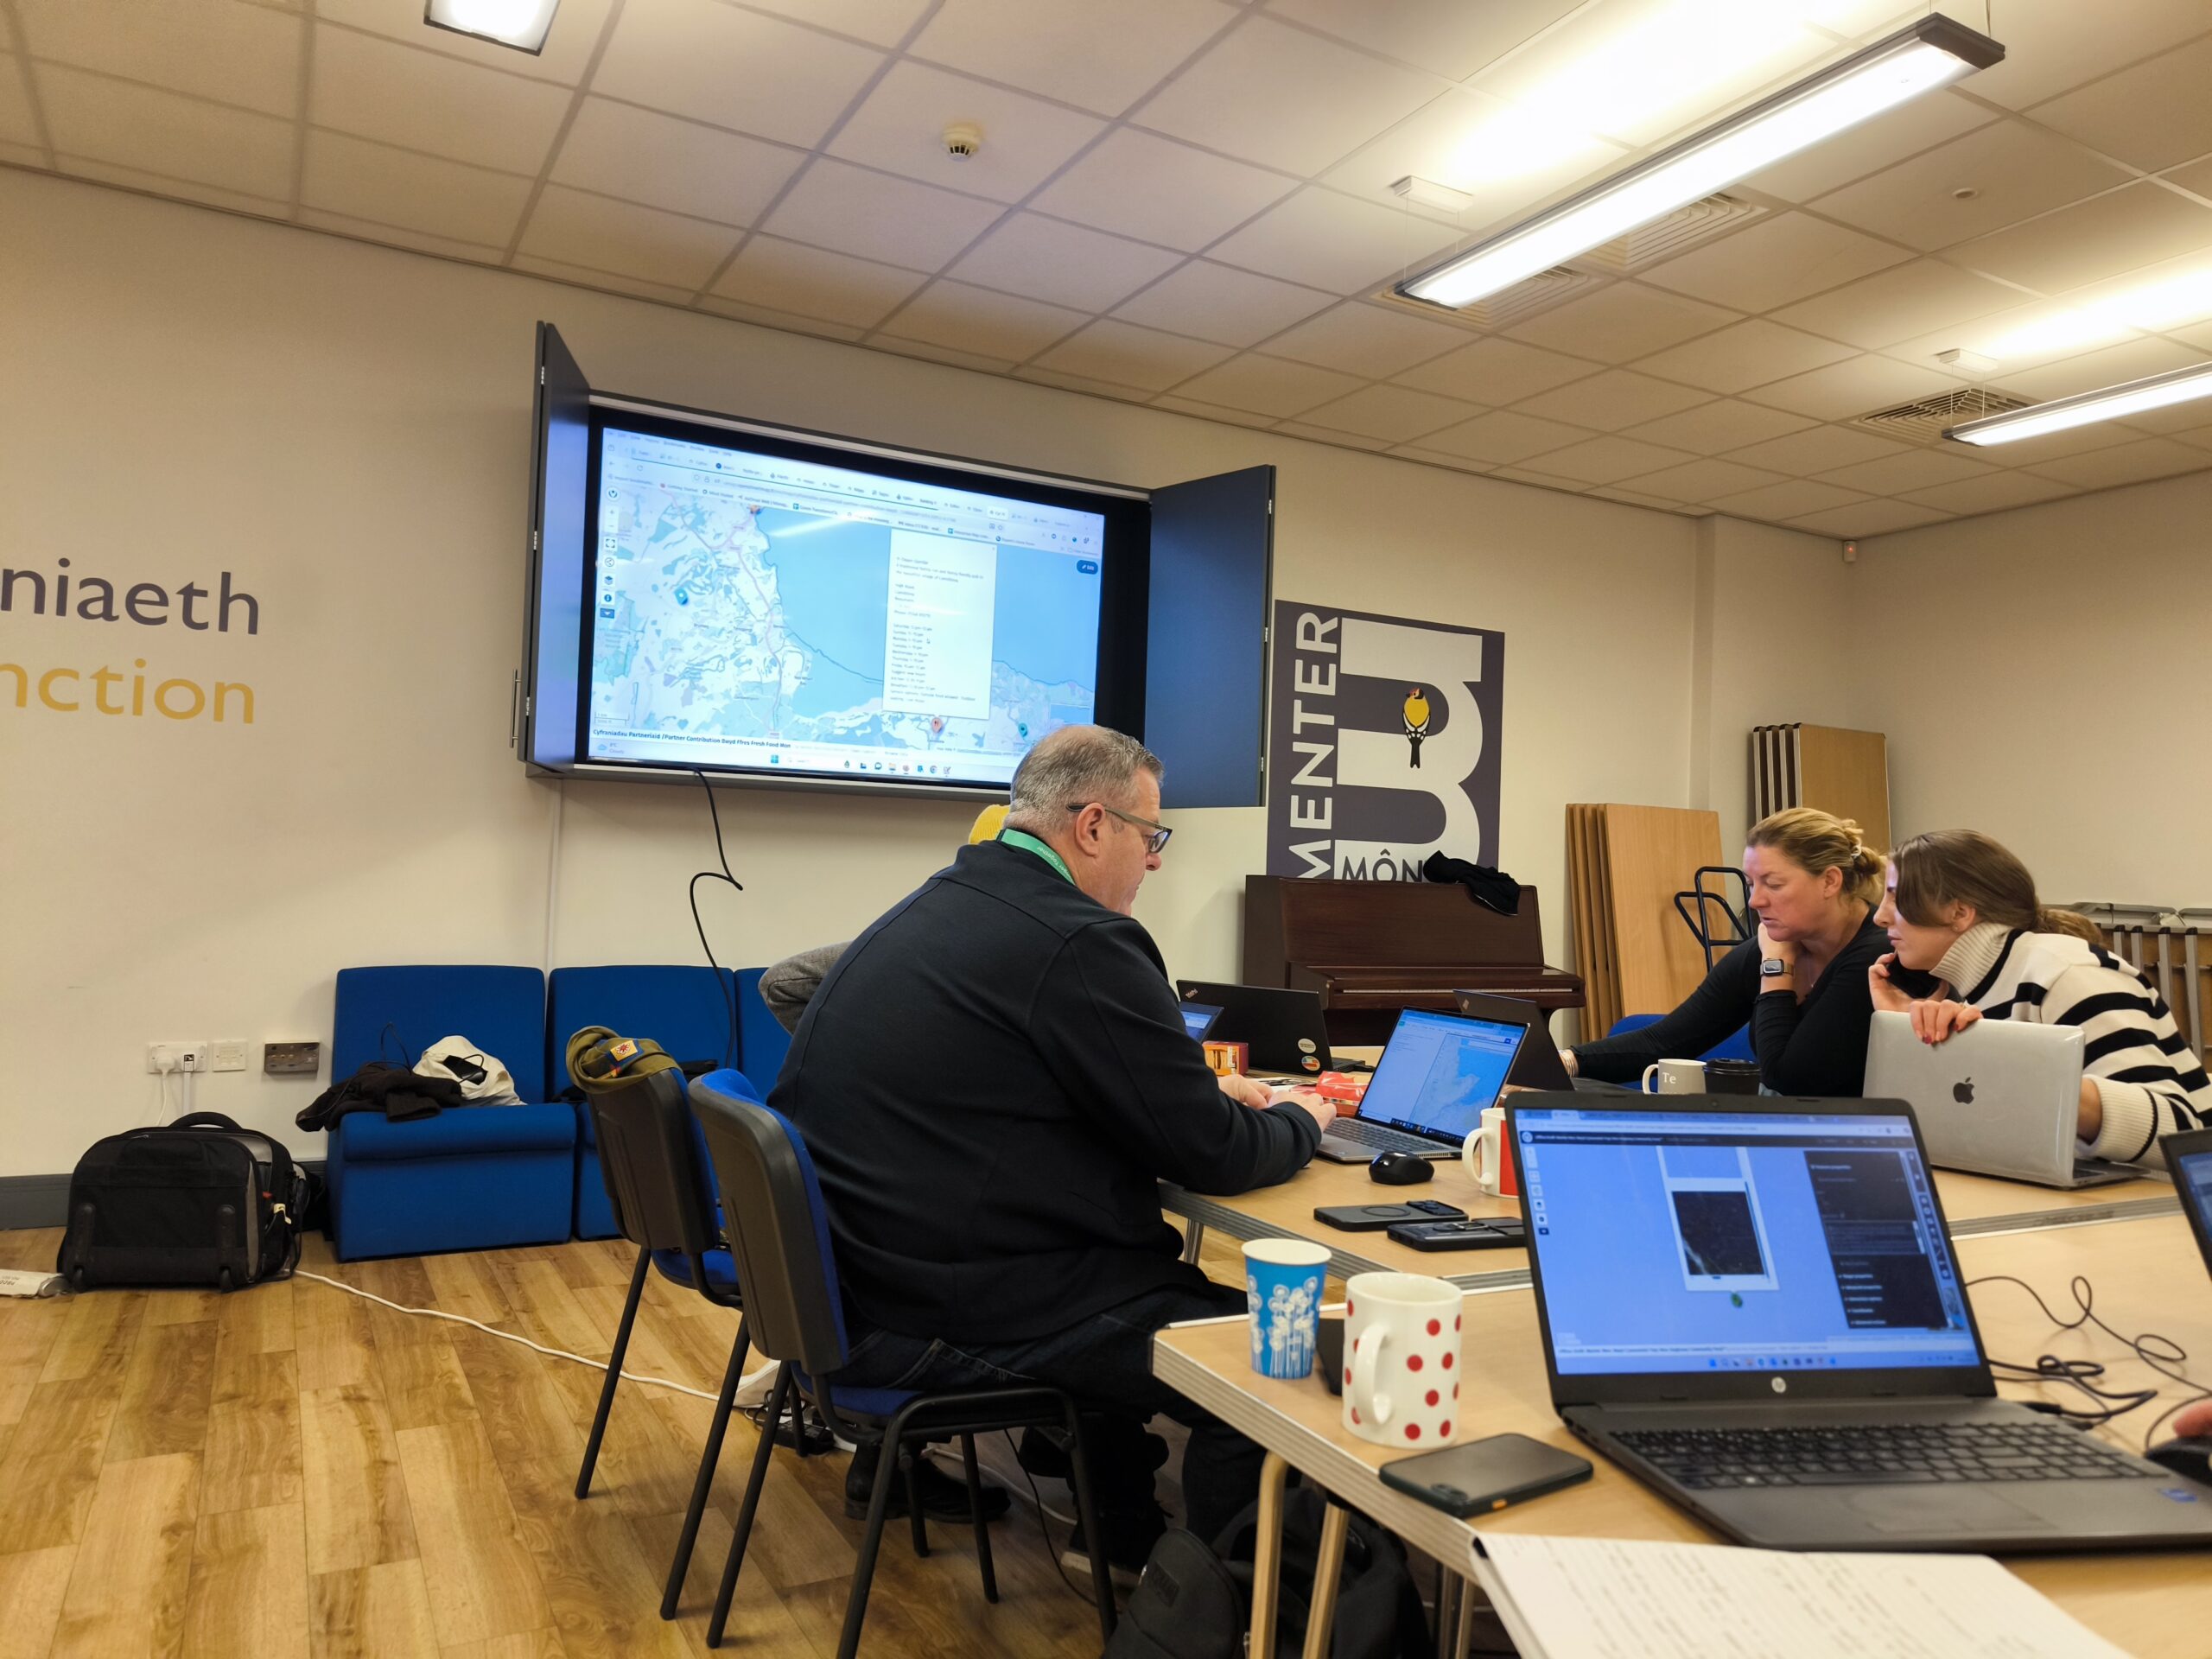
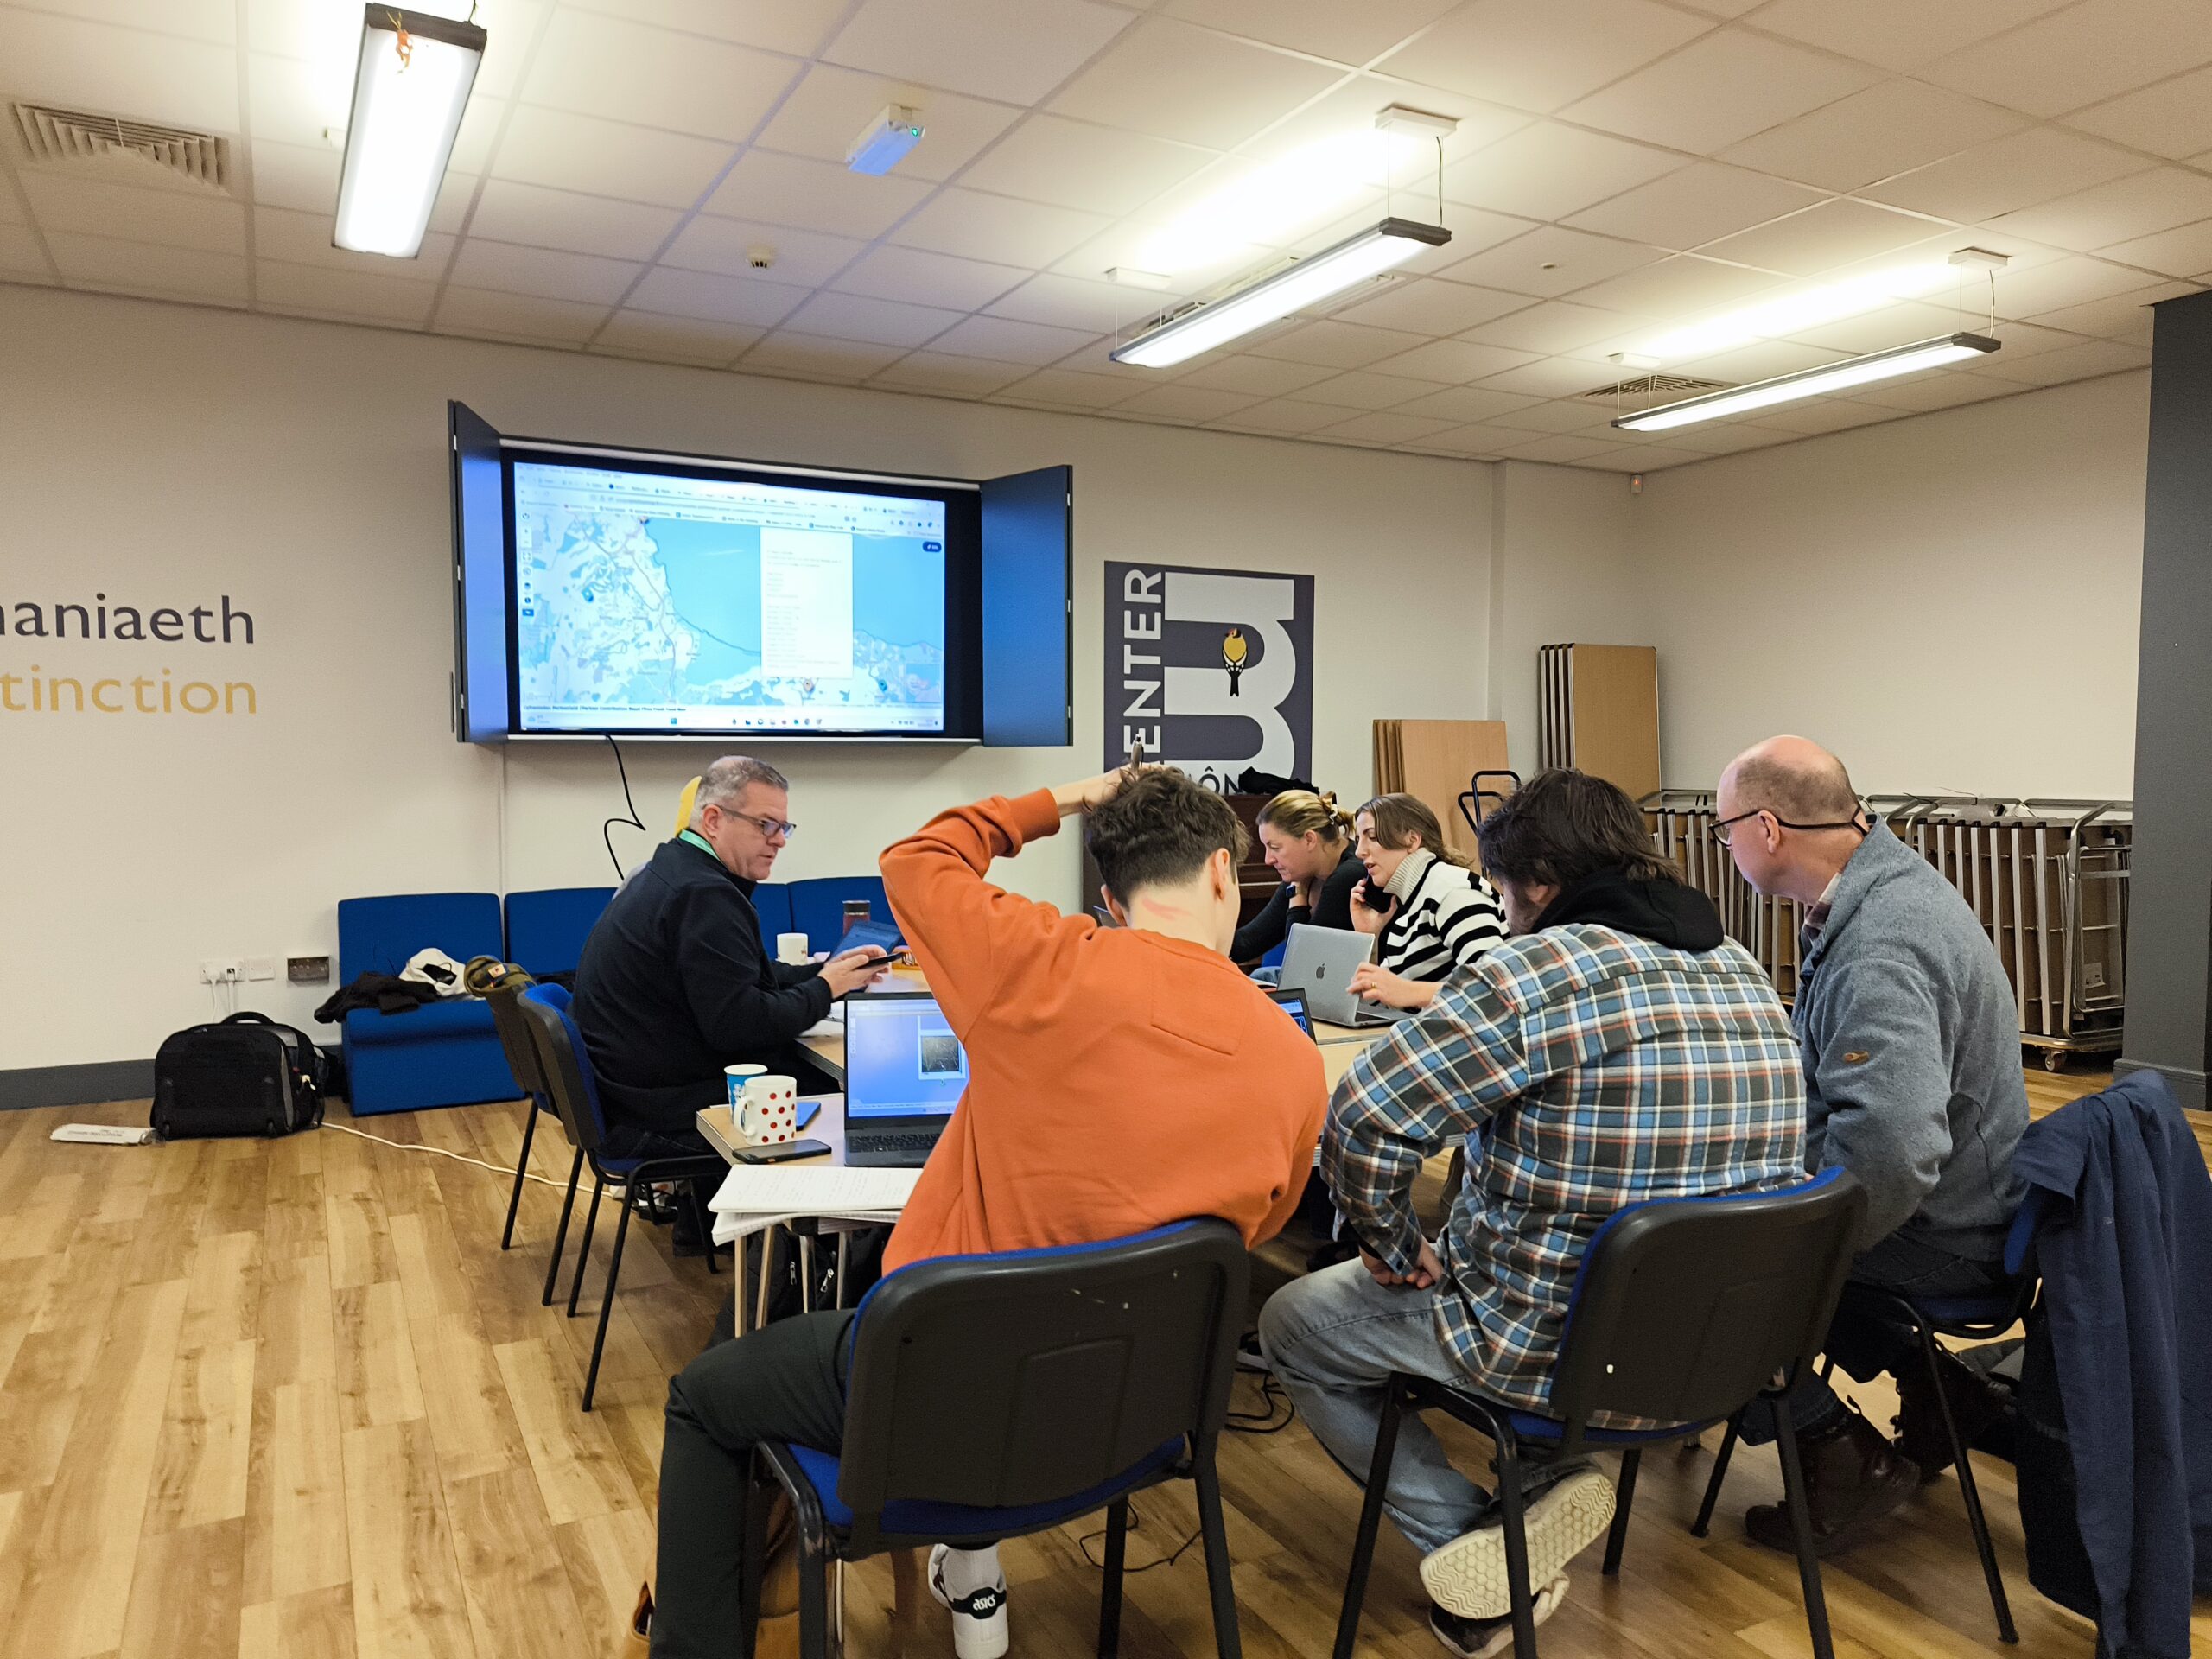
    The last Menter Môn Ltd “Ynys Môn Food-Partners” mapping workshop of 2025 had us thinking about food poverty on Anglesey this Christmas.

    Our growers, producers and retailers are mapping their own supply/distribution networks, and are optimising their branding “hyper-locally”, communicating some rich and diverse interests (e.g. a map of honey-bee flowers and pollination areas).

    But food maps can also provide insights relevant to people in need, mapping social exclusion factors, food access and affordability. These maps can then operationally connect local-food sources, crisis networks, and food surplus resources – a cooperative vision of food equity.

    “All the bus stops are the red pins, and the heat map is where we deliver emergency parcels over the last 12 months” says Scott, of Banc Bwyd Môn.

    “I am involved with the food bank and tackling destitution together… I have managed to locate all our external partners that offer support advice and aid on the island and refer in to us at the food bank (green icons)… ”

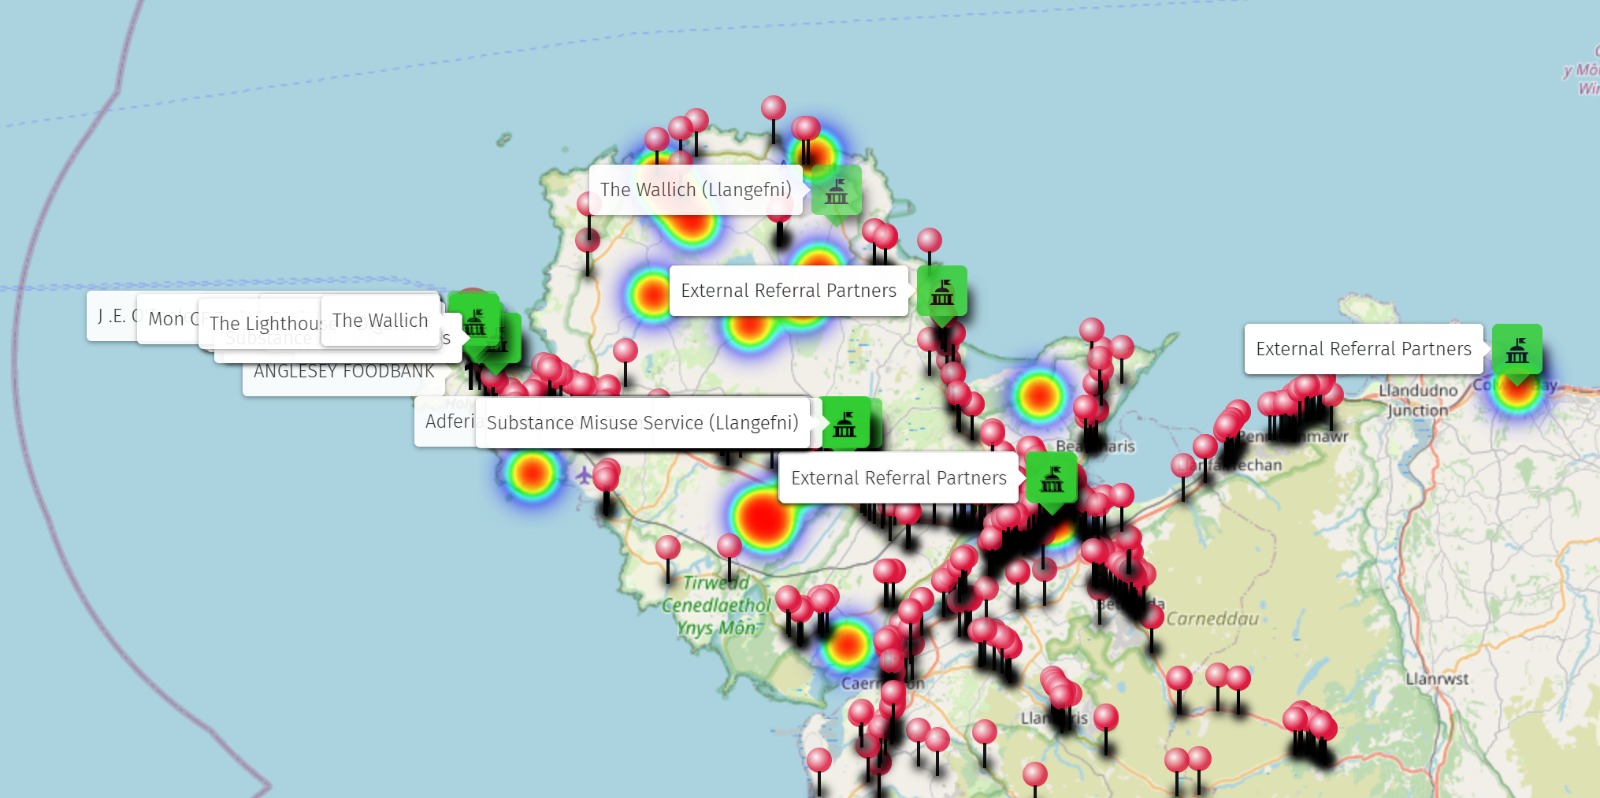
    Scott’s “supply-and-demand” map shows us how the needs for food support are concentrated in areas that are far from public transport routes. He explains:

    “Key points for the project are the rural areas and the density of emergency aid possibly due to no public transport and lack of shops… paying a higher price due to convenience… that data is so important to provide basic food: and alternatives for those who cannot get to supermarkets and choice…”

    Scott’s map displays the locations of fresh food and local businesses alongside information about food accessibility: inclusivity, affordability and equity. Within a few clicks, compelling stories emerge about the effect of public transport on ‘food isolation’, and the need to map informal food networks in a community-owned and inclusive way.

    Thanks to Humanitarian OpenStreetMap Team for tech support, @UNESCO #geoparks, Rhaglen ARFOR, and @Public Map | Map Cyhoeddus for #osm contributions.
    Some partners: Anglesey Bees Melin Llynon Mon Cyngor Anglesey Foodbank Anglesey Fine Foods Bangor University, International

    [Read more about OpenStreetMap Food Desert mapping in Wales here:
    https://lnkd.in/eagtcM6A]

    #opendata #wellbeing #futuregen #autoethnography #missingmaps #foodsecurity #NHS Menter Mon #OSM, #CommunityMapping #gwerintech #fooddeserts #resilience Public Map | Map Cyhoeddus

  • Pete’s Map of Hyper-Local Football clubs

    During field-mapping, we discovered that in Ceredigion there are lots of community-run football clubs, and many are now disused, waiting to be regenerated.

    Here is a map:

    Clybiau Pel-Droed Cymuned Ceredigion – Yn y Gorffenol a’r Presennol Community Football Clubs – Past and Present – Credit: Pete Bentham/Cyfranwyr OSM Contributors

  • Blog 1

    Maps of the Mapio Lleisiau’r Tir/Mapping Land Voices are starting to emerge. THIS ONE shows Placenames of buildings, farms, ruins and features, all of which carry what historians call “Intangible Cultural Heritage” (the community’s memory, in language found in the landscape).

    Focus of the Ceredigion uplands pilot: connectivity, conserving cultural fabric, language place-making.

    The objective is that this bespoke mapping methodology can be handed over and continues to be owned and developed by the community in further self-initiated projects. No map is innocent, and with OpenStreetMap, no map is ever finished. Like Wikipedia, it is a conversation, an ongoing participatory collaboration between communities and the global public. It is conspicuously partial, “decolonises” that myth of a singular truth, and is an expression of people reclainming how their community is seen by the outside world.

    We are managing to connect generations through the project, and new partners are stepping forward (e.g. Age-Friendly Ceredigion (ceredigion CC), National Library (again) to scale new versions of this pilot,


    People in these areas face depression, anxiety and other mental health issues, many of which are derived from the precarious nature of existence over decades of cultural and economic degeneration. People have lost the networked society which used to connect them. The frameworks of farm, industrial, chapel, pub and even school networks have now been railroaded into urban areas. The language in which people think (free-thought, a basic human right) has been under threat for generations, and has become unconnected with practical life and the reaffirming factors of social and practical function. These arguments have become hakcneyed, perhaps, and are nowadays seldom voiced, but maps are creative and positive ways to present this point of view with meaningful and constructive outcomes.


    [We are finding that analytics maps about human needs and access within these communities are extensively pointless: mapping where there are no buses, public toilets, shops, clinics and schools turns out extreme metrics: there IS no mains sewage, mains gas, etc. In areas of ‘no-car-share-culture’, the fact of three buses a week mean 100% of the population depend upon cars. No public toilets in villages makes for an ‘all-red’ data layer.

    So more useful maps emerging show us a particular preference, priority indicator set defined by communities.]

    Wellbeing maps can provide analytics about human needs and access within upland areas suffering from rural isolation factors. But these are also particular, showing the distinct character of a community by its self-elected indicator rather than being defined by tourism/external and remote institutions.

    Click and rummage round, to see how past contextualises present, and qualitative anecdote shows a perspective which can be used to make quantitative measurements: lived experience maps can narrate but also celebrate a community life historically starved of resources like public transport.

    Maps visualise distances from services, highlight place name changes (cultural changes), and image rural depopulation at work (e.g. named farms which have become ruins within living memory). Community visibility is expressed in terms of ingenuity, coping mechanisms, and self-organising potential for micro-hydro energy, small enterprise, and technical skills regeneration. Most of all, maps can make a case for resource allocation such as systemic and administrative support for communities well-capable of self organising their wellbeing. Many clearly remember times when community electricity was normal, public transport was reliable, and each person in the community participated…..Onward!